Debug layers are commonly used in game development; they represent the visual form of a real-time debugger. In this article, I want to give a quick introduction to debug layers – what they are and how to implement one using the Godot game engine. So grab a coffee, and let’s dive into the world of runtime debug layers!
What Is a Debug Layer?
A debug layer is a screen layer rendered on top of the game, used for debugging purposes. The debug layer scene and all its child nodes are separately rendered, completely independent of the current scene, game camera, or any other object that might affect it.
During game development, real-time information about the game’s status is often necessary. While using the logger to print information is an option, there are many cases where the logger falls short.
A straightforward example is the Frame Rate counter. Printing the frame rate to the log isn’t practical as it would flood the entire log with numbers, causing clutter. What’s needed is a real-time text display at the top of the screen, showing the current frame rate.
An advanced example might involve character physics parameters, object states, or internal values. This could even include visual debugging, such as marking around player characters, enemies, or other objects of interest.
How to Implement a User Interface Debug Layer in Godot
1. Creating a New Scene With a CanvasLayer as the Root Node
Create a new scene with a CanvasLayer as the root node. The CanvasLayer node serves as the foundation for all nodes rendered in 2D space. This node is excellent for static user interfaces because it’s independent of any scene or camera existing in the game.
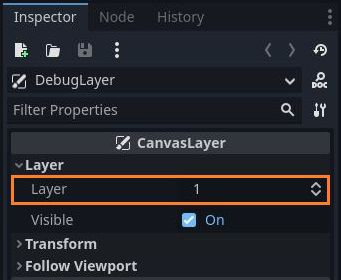
Each CanvasLayer node in Godot has a ‘Layer’ property, which determines the distance from the screen (independent of the z-index). A higher layer value means the layer will be closer to the camera, while a lower layer value means the layer will be drawn farther from the camera. You can find the ‘Layer’ property in the Inspector of the CanvasLayer node.
This implies that the ‘Layer’ property of your CanvasLayer must be set to the highest value among all other nodes in your game. Otherwise, it will be drawn behind other nodes and might be partially occluded or completely hidden.
2. Adding the Debug Fields and Labels Under the CanvasLayer Node
Under the CanvasLayer node, you’ll need to add the user interface elements you wish to display.
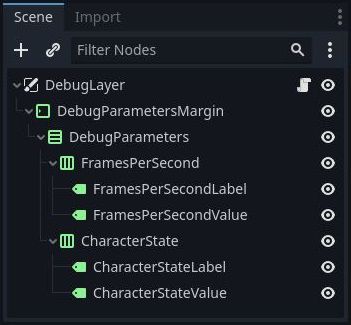
In my example, I included a couple of labels that display the current frame rate and the character’s state in the state machine. The label’s text updates during runtime through the methods you’ll need to implement in the script.
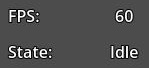
Here is the actual user interface debug panel created in this scene:
3. Implementing the Methods for Updating the Debug Fields
Next, attach a new script to the root node and implement the methods that control the UI elements. For instance, updating the text in a label should occur through a method that takes a string as an input parameter. Conversely, something like an FPS counter, which doesn’t require an input, can be updated by overriding the _physics_process(delta) method. You can see the code in the snippet below.
extends CanvasLayer

@onready var m_NodeFramesPerSecond : Label = get_node("DebugParametersMargin/DebugParameters/FramesPerSecond/FramesPerSecondValue")
@onready var m_NodeCharacterState : Label = get_node("DebugParametersMargin/DebugParameters/CharacterState/CharacterStateValue")

# Set the frames per second text on the top left corner of the screen
func _physics_process(delta) -> void:
	m_NodeFramesPerSecond.set_text(str(Engine.get_frames_per_second()))

# Set the character state text on the top left corner of the screen
func SetCharacterState(text : String) -> void:
	m_NodeCharacterState.set_text(text)
4. Adding the DebugLayer Scene to the Project’s Autoload List
Now that you have the scene and script ready, you can add the scene to the autoload list in the project settings window. If you’re unfamiliar with the Autoload concept in Godot, I recommend reading this article for a better understanding of autoloaded scenes in Godot 4.
5. Calling the User Interface Update Methods From Your Code
An autoloaded script will automatically become global in GDScript, which means you can access the UI update function from any place in your code.
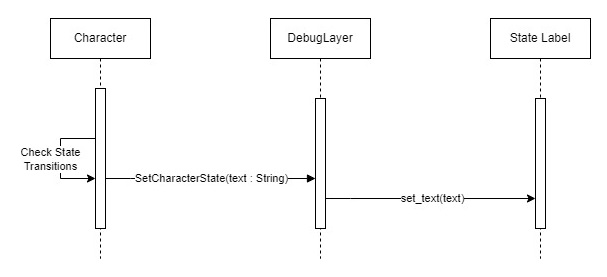
In my example, whenever the character changes state, I call a method found in the DebugLayer script that updates the state name in the top left corner of the screen.
The flow diagram illustrates the method call chain from the character node to the state label node.
6. Running the Game and Testing the Debug Layer
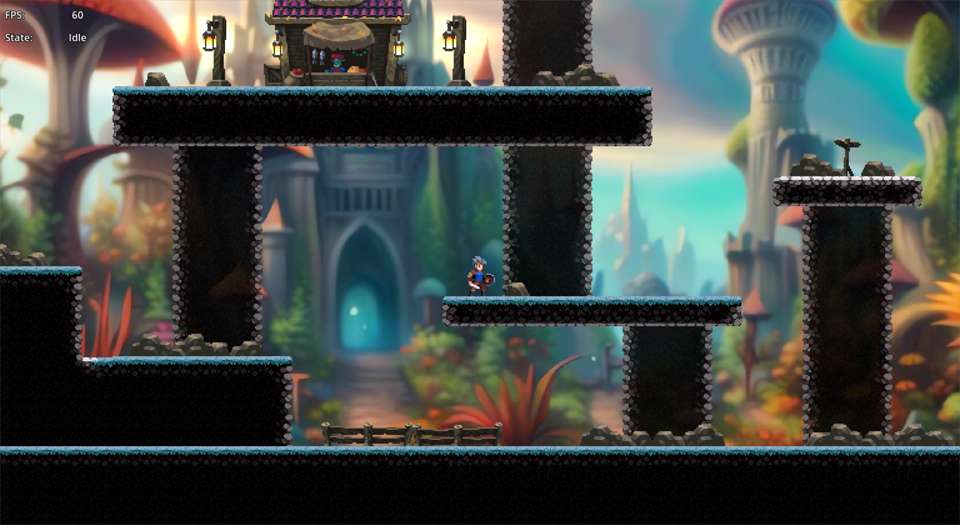
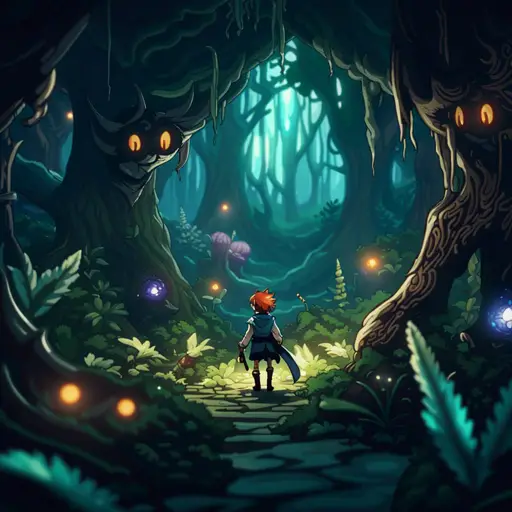
Here are some screenshots from the example project I’ve created. You can see the FPS counter and the character state displayed at the top left corner of the screen. The information on the debug layer remains on top of everything rendered on the screen, regardless of the current scene or camera movement.


Learning More Game Development Topics
Game development is a complex art form that encompasses various topics such as art, software, animation, storytelling, marketing, and many more. I invite you to join me on a journey to create the most amazing games and make your dreams a reality. Visit the Night Quest Games Blog to read more.
If the information in this article was helpful to you, please consider supporting this blog through a donation. Your contributions are greatly appreciated and allow me to continue maintaining and developing this blog. Thank you!


Nice idea and good description! Many thanks for sharing! 🙂
Thanks! I appreciate the kind words 🙂